
Who doesn’t love the weather? It’s universally relevant, physically amazing, frequently dramatic, and overflows with data that almost — but never quite — lets us predict its behavior. Weather inspires a never-ending array of super-awesome gadgets and gizmos — beautiful antique barometers, science projects that turn DC motors into anemometers, classic home weather stations from La Crosse and Oregon Scientific, NOAA-driven emergency alert radios… the variety is endless, and apparently I own them all.
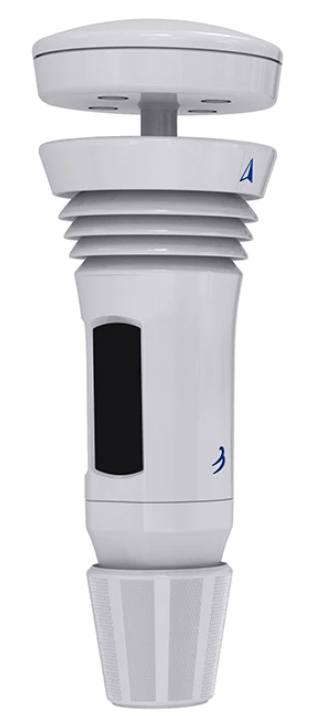
Most recently I purchased a WeatherFlow Tempest for our place on Whidbey Island. This thing is absolutely amazing. With zero moving parts, it detects temperature, humidity, precipitation (amount and type), wind, pressure, solar radiation and nearby lightning strikes. It computes a ton of derived metrics from these base data. It customizes the forecast for the local microclimate. And of course it’s fully connected to the cloud and has a published, robust API that anyone can use. It’s basically weather cocaine.

The only thing missing is a great at-a-glance, always-on tabletop display. There’s a solid phone app, and the web site is perfectly serviceable. But I wanted something that looks good in a room and can quickly show if you’ll want a raincoat on your walk, or which day will be better for the family cookout. Something more attractive than an iPad propped up in the corner.
You’ll have to judge for yourself how well I did on the “attractive” part, but I did manage to put together a piece that I am pretty happy with. The base is cut from a really nice chunk of spalted birch driftwood I found a few months ago, and the display was my first serious work with the Raspberry Pi platform, which is freaking awesome by the way. I even managed to squeeze a little Glowforge action into the mix. Lots to talk about!
Hardware and Platform
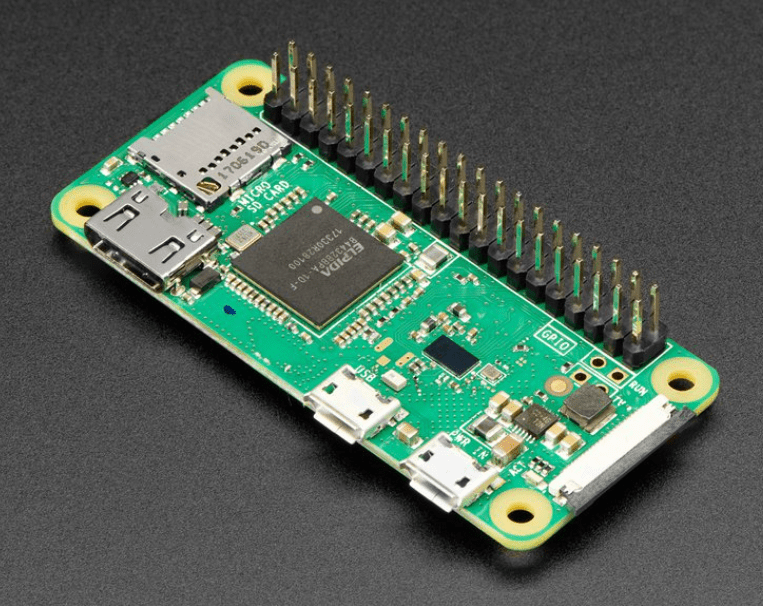
The core of the display unit is a Raspberry Pi Zero WH with a 5” HDMI display that attaches directly to the header block. The Zero is a remarkable little unit — a complete Linux computer with built-in wifi, HDMI, USB and 512mb of RAM for … wait for it … $14. Yes that is actually the price. You need to add an SD card for a few bucks, and the display unit I picked was a splurge at $47 — but all-in the cost of hardware was about $70. Stunning.
The nice thing about this combo is that adding software is about as far from “embedded” development as you can get. Again, and I can’t say this enough — it’s just Linux. I used Java to build the server and rendered the display using plain old HTML in Chromium running in full screen “kiosk” mode. An alternative would have been to buy a cheap Android tablet, and that probably would have worked fine too, but I just don’t love building mobile clients and it’s harder to set them up as a true kiosk. The web is my comfy happy place; I’ll choose it every time.
There are a ton of good walkthroughs on setting up a Pi so I won’t belabor that. In short:
- Set up an SD card with the Raspberry Pi OS. The setup app is idiot-proof; even I got it going ok.
- Connect the Pi to the real world with a 5V power supply (USB-C for the Zero), a monitor through the mini-HDMI, and a keyboard/mouse via USB-C.
- Boot it up, connect it to your wifi, and set up sshd so you don’t have to keep the monitor and keyboard connected (
ifconfig | grep netmaskis an easy way to find your assigned IP).
Yay, you now have a functional Pi! Just a few more steps to set it up for our kiosk use case:
- Attach the display to the header block and connect it to the mini HDMI port. I used a little right-angle cable together with the 180° connector that came with the display. The connection is a bit cleaner if you use the larger Pi form factor, but I stuck with the Zero because it made for a more compact power supply connection. Optionally you can enable the touchscreen, but I didn’t need it for this project.
- Set a bunch of options using
raspi-config:- Boot into X logged in as the “pi” user (System Options -> Boot / Auto-Login -> Desktop Autologin).
- Ensure the network is running before Chromium starts (System Options -> Network at Boot -> Yes).
- Disable screen blanking (Display Options -> Screen Blanking -> No).
- Hide the mouse pointer when it’s idle.
sudo apt-get install unclutter
- Add the line
@unclutter -idle 0.25to the end of the file/etc/xdg/lxsession/LXDE-pi/autostart
- And finally, tell the pi to open up a web page on startup by adding the line
/usr/bin/chromium-browser --kiosk --disable-restore-session-state http://localhost:7071/to the end of the sameautostartfile as in #3 above.
A lot of fiddly little settings there, but the end product is a 800×480 display that boots to a web page in full screen mode and just stays there — just like we need. Whew!
Software, Data and Layout
The Tempest really is nerdvana. You can interact with its API in three ways:
- The unit broadcasts real time observation packets over the local network via UDP port 50222 (I haven’t implemented this as yet).
- The WebSocket API enables subscriptions to similar push messages from the cloud (my client is TempestSocket.java).
- Observations and rich forecast data can be pulled from the cloud with the REST API (my client is Tempest.java).
For this project I’m authenticating to the cloud APIs using “personal use tokens” — simple strings allocated on the Tempest website by the station owner. There’s a rich OAuth story as well, but I wasn’t psyched about implementing the grant user experience flow on my little embedded display, and tokens work fine.
My weather station is really just a forecasting box, so it only needs the REST piece. Server.java implements a simple web server (using my trusty WebServer.java and Template.java utilities) that serves up two endpoints:
main.html is a simple container that targets the actual weather dashboard in a full-page iframe. A javascript timer refreshes the contents of the frame every four minutes, which seemed reasonable for forecast data that doesn’t move very quickly. I chose this approach to maintain resilience across network outages — so long as this page stays loaded, it should continue to happily reload the iframe on every cycle regardless of whether that page actually loads or not. I also realized that it sets up a cool vNext option — this main page could manage a dynamic list of pages to rotate through the kiosk, which would be fun on holidays or to add news or other information sources. Saved to the idea list!

dashboard.html.tmpl is the real workhorse of all this. Its server-side code is in registerDashboardHandler, which makes the REST calls to fetch Tempest data, preprocesses it all so it’s ready to merge into the template, and then calls render to fill in the blanks. I talked a little bit about the templating utility in a post a few weeks ago — it’s more than String.replace but much less than Apache Velocity … works for me.
At the end of the day, we get a nice display that shows current conditions and the forecast for the next five hours and five days — perfect for planning your day and week. The background color reflects current temperature (talked about that a few weeks ago as well!), and I’m grateful that the good folks at Tempest don’t restrict use of their iconography because it’s way better than anything I would have come up with myself!
The server process itself is just a Java app that also runs on the Pi. I considered hosting this part in the cloud somewhere, but keeping it local was another way to reduce the number of moving parts in the solution, and to add some resilience during network outages.
Cloning and building requires Maven and at least version 11 of the JDK to be installed. The Pi’s ARMv6 processor did present a wrinkle here; I needed to install a pre-built JDK from Azul. This post by Frank Delporte was a lifesaver; thanks Frank! Once all that is sorted; these commands should do the trick:
git clone https://github.com/seanno/shutdownhook.git
cd shutdownhook
git checkout jdk11
cd toolbox && mvn clean package install
cd ../weather && mvn clean package
Configuration is a simple JSON file that at a minimum provides the port to listen on and access credentials for the Tempest:
{
  "Server": { "Port": 7071 },
  "Tempest": { "Stations": [ {
    "StationId": "YOURTEMPEST",
    "AccessToken": "YOURPERSONALUSETOKEN"
    } ] }
}
And while there are fancier ways to get background processes running on startup, it’s hard to beat my old friend /etc/rc.local for simplicity. The following (long) line in that file gets the job done:
su -c 'nohup java -Dloglevel=INFO -cp /home/pi/weather/weather-1.0-SNAPSHOT-jar-with-dependencies.jar com.shutdownhook.weather.Server /home/pi/weather/server-config.json > /home/pi/weather/log.txt' pi &
Cutting and Shaping the Base
With the digital piece of this project taken care of, the last major subproject was the base itself. I knew I wanted to use this beautiful spalted birch log I picked off of the beach, but spun for a while trying to figure out an approach I liked. I didn’t want to do a wall mount because of the power supply; batteries wouldn’t last and a cord hanging down the wall is just too tacky. If it was going to sit on a desk or side table, the display needed to be presented at an angle for visibility. Eventually I settled on a wedge-shaped cut that presents about a 30° face and highlights some of the coolest patterns in the wood. My humble WEN band saw needs some maintenance, but it’s still my go-to for so many projects — a great tool.
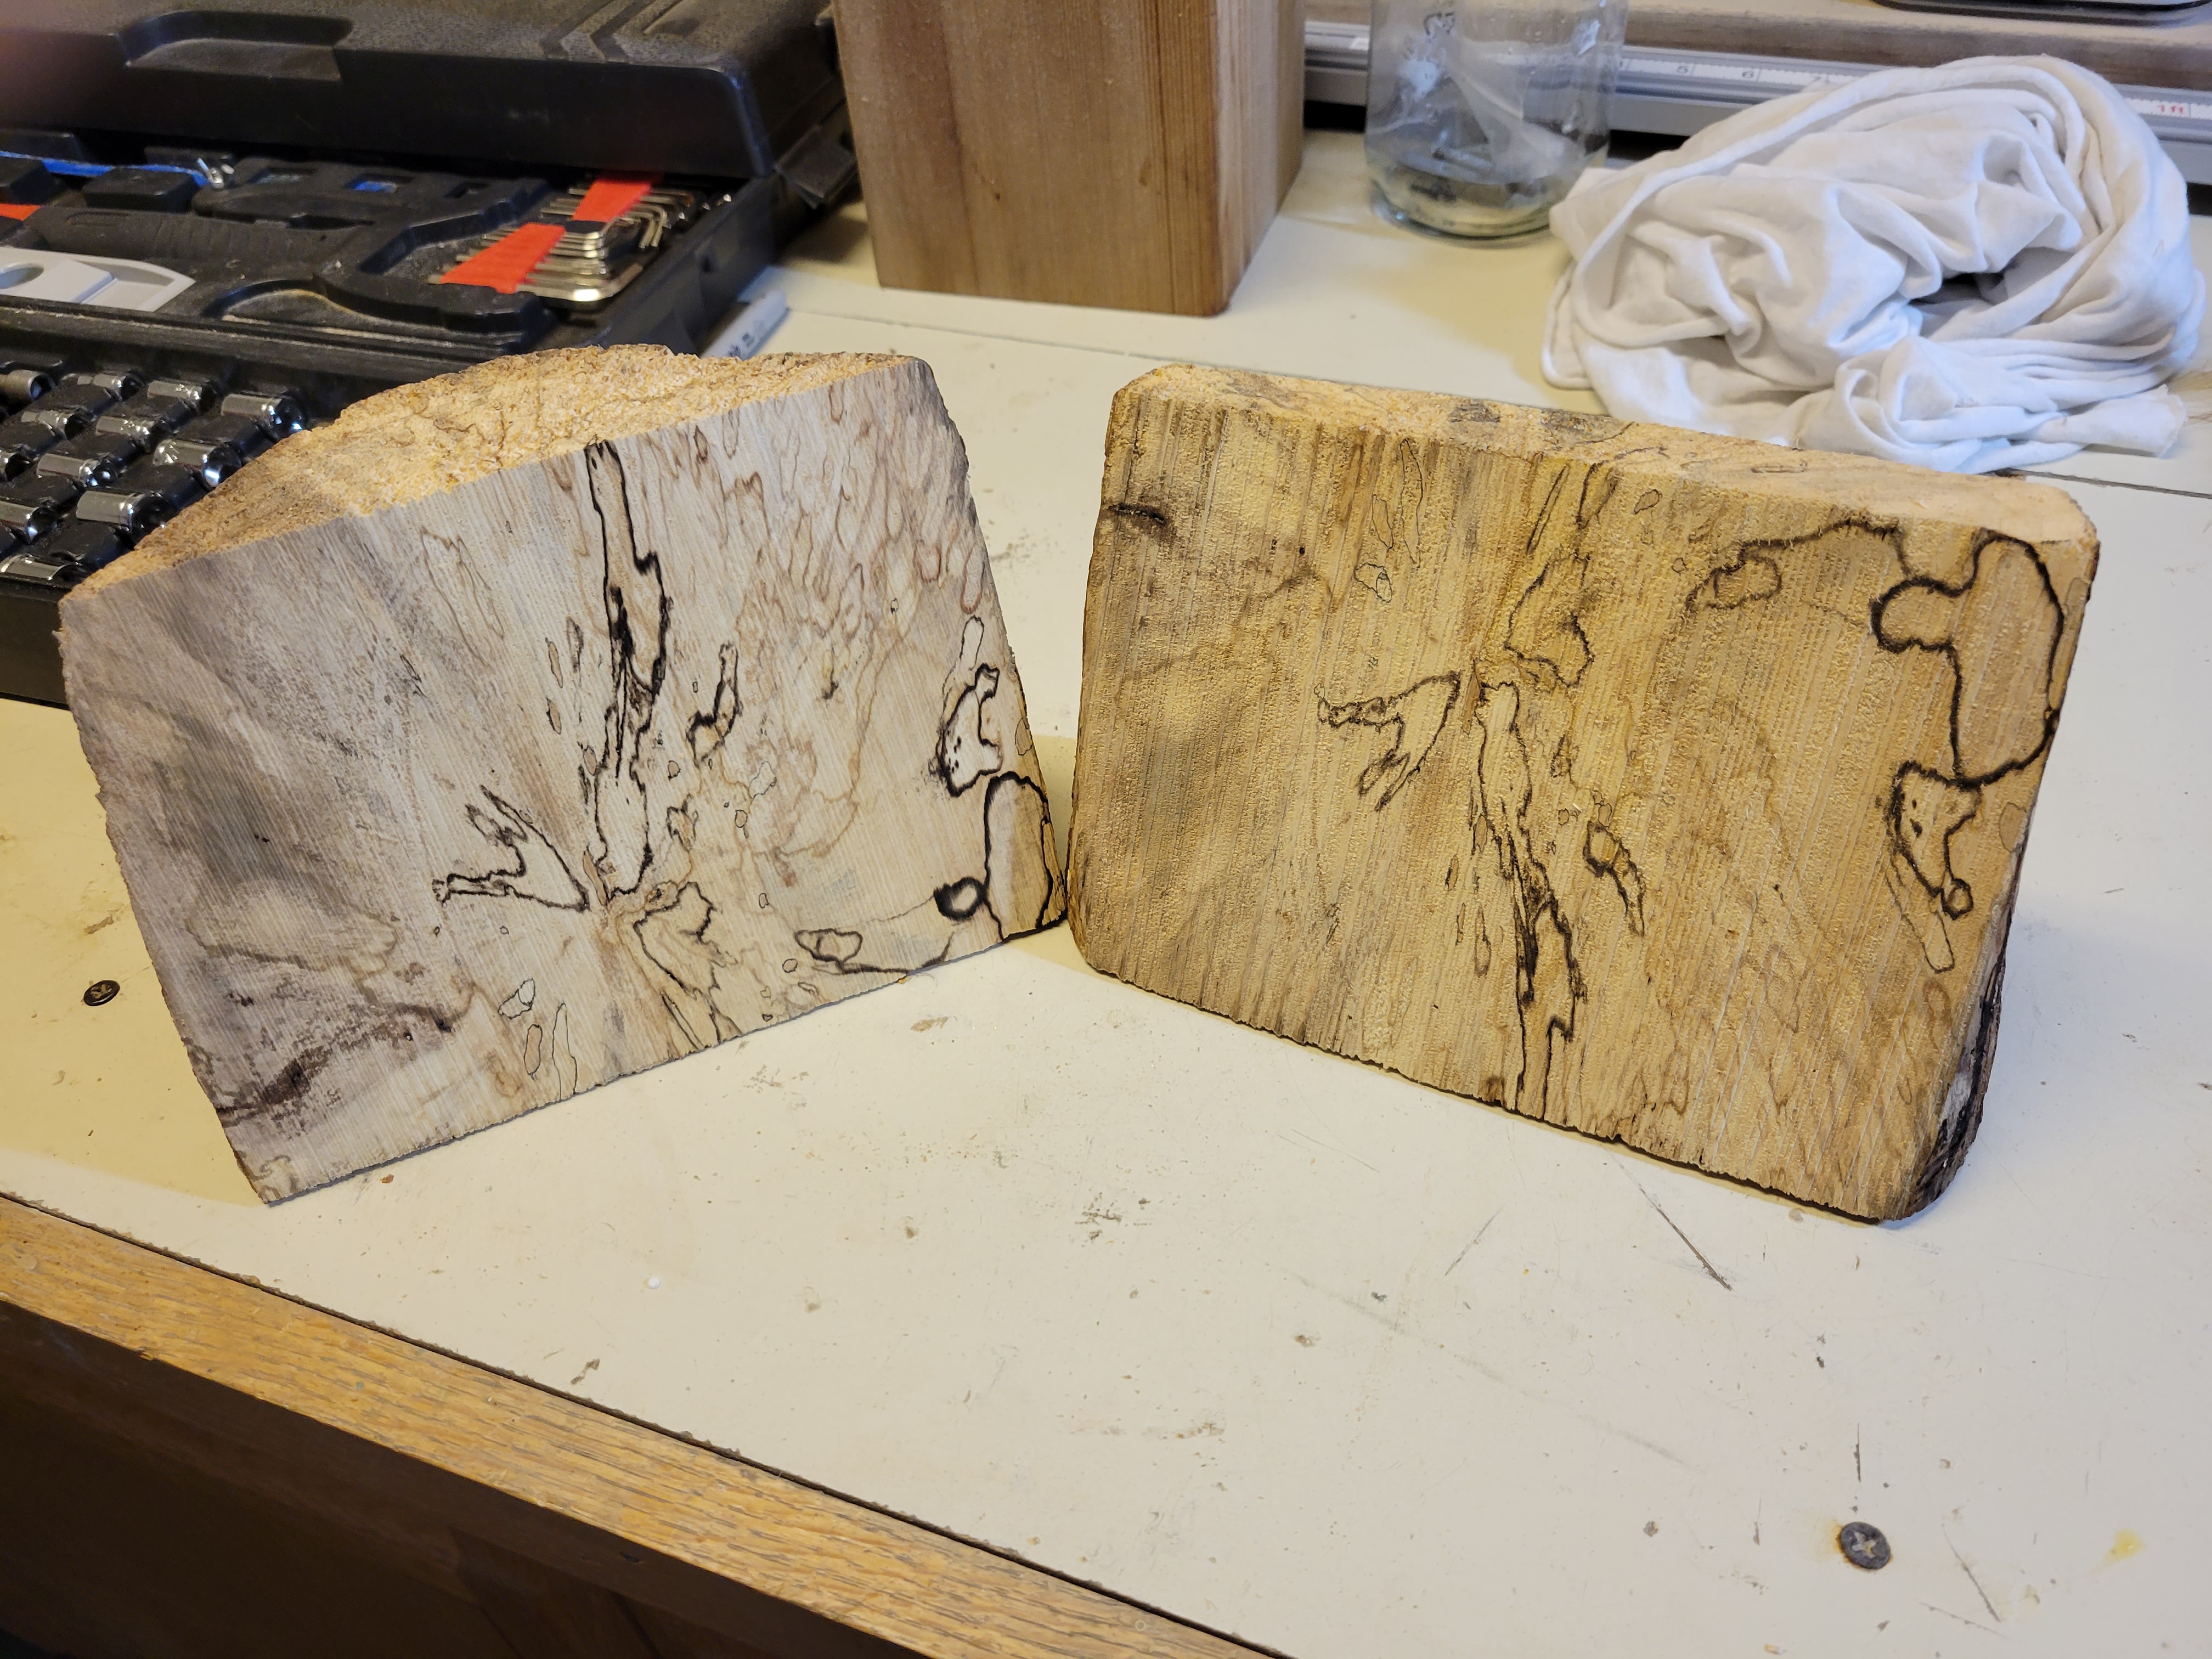
To embed the display unit into the base, I had to create a rectangular cavity about 1.5” deep (well, mostly rectangular with a stupid extra cutout for the HDMI adapter). I’m not really skilled enough with my router to feel confident plunge-cutting something like this, so instead I just used the drill press and a Forstner bit to hog out most the material, then cleaned it up with a hand chisel. I drilled a grid of holes through the back of the piece to keep the electronics cool and pull through the power cord, sanded it to 120 grit and had something pretty ok!
I ended up finishing the piece with a few coats of penetrating epoxy resin. I had planned to use Tung oil and beeswax, but the wood turned out to be super-dry and much softer than I’d thought, so it benefited from the stabilizing properties of the epoxy. The final result is pretty durable and I do like the way the glossy finish brings out the darker marks in the wood.
Putting it all Together
So close now! I just needed a way to secure the display in the base and cover up the edge of the cavity and electronics. I used the Glowforge to cut out a framing piece from 1/8” black acrylic, complete with pre-cut holes for some nice round-head brass screws at the corners. A little serendipity here because the epoxy finish really matched up well with the shiny black and brass. A little adhesive cork on the bottom of the unit made it sit nicely on the table, and finally that was a wrap!
What an amazing experience combining so many different materials and technologies into a final project. I have become somewhat obsessed with the Raspberry Pi — it just opens up so many options for cool tech-enabled projects. Just last night I ordered a daughter card that teaches a Pi to speak Z-Wave, the protocol sitting dormant in a bunch of light fixtures in my house. Disco Suburbs here we come!
Oh wait, one last technical note: as assembled, the USB connectors are inaccessible unless you unscrew the frame and pull the unit out. That’s not a huge deal, but if you’re going to run the station in a location other than where you started (i.e., on a different wifi network), it makes on-site setup a hassle. You can preempt this by pre-configuring the unit to pick up additional wifi networks. In the file /etc/wpa_supplicant/wpa_supplicant.conf, just clone the format you see already there to add additional “network” entries as required.
All of the code described in this article can be found at https://github.com/seanno/shutdownhook/tree/jdk11/weather.


