
A year after leaving Adaptive Biotechnologies, I am still blown away by the science that happens there. They’ve built a unique combination of wet lab techniques and creative computational analysis, and it continues to pay off. Most recently the team published a paper that describes a novel method for assessing the probable impact of mutations for folks with vaccinated or natural immune memory against a virus (in this case, Omicron vs. previous SARS-CoV-2 strains). Even in the avalanche of COVID noise, this deserves a closer look.
The punchline is that Omicron probably impacts out T-Cell response by about 30%. But it’s how they got to that number that makes me optimistic about our ability to get ahead of this bullsh*t. Starting with immunoSEQ in 2009, Adaptive has built layer upon layer of understanding about how immunity works — relentless focus by smart folks in an insanely complex environment, using math.
I’m going to walk through each of the methods that led up to the most recent paper. I’ll try to give enough detail to make sense, but also provide links to much more. To my ex-colleagues, apologies in advance for everything I get wrong and/or over-simplify.
What’s a T-Cell?
T-Cells are part of our “adaptive immune” system. They are manufactured in our thymus, each with a unique “receptor” site in their DNA, generated at random through VDJ recombination. This receptor sequence translates into a protein structure on the surface of the T-Cell that “binds” with (in practice) exactly one antigen. Antigens are fragments of DNA from invading molecules — including the SARS-CoV-2 virus that causes COVID-19.
T-Cells circulate around our body in blood and lymph, “hunting” for their corresponding antigen. When a match is found, that T-Cell makes a bunch of copies of itself and takes action either by killing infected cells directly (“Cytotoxic” T-Cells) or recruiting B-Cells to go on the attack (“Helper” T-Cells). Assuming the foreign body is killed before the host dies, some of the matching T-Cells eventually retreat into “memory” status, where they lay in wait for the same enemy to return.
Obviously that is a much-abridged version of the story; Khan Academy has a great article that provides more context. For our purposes today, the key points are: (a) T-Cells are central to our bodies’ ability to fight off foreign invaders; and (b) each T-Cell is coded to match a very specific fragment of foreign DNA.
Layer 1: immunoSEQ
Way back in 2009, a your-peanut-butter-my-chocolate moment inspired Harlan Robins and Chris Carlson to invent what became immunoSEQ — a method for cataloging the millions of T-Cell receptor sequences found in a tissue or blood sample. Refined over many years, this assay is now the de facto industry standard for assessing diversity and tracking specific T-Cells in a ton of diverse research and clinical settings.
immunoSEQ works because of the way receptor sequences are generated — each one starts with one of 168 “V(ariable) Gene” archetypes and ends with one of 16 “J(oining) Gene” archetypes. There is extreme diversity between them, but the bounded end sequences make T-Cell receptors amenable to isolation and amplification with Multiplex PCR. Adaptive has created a library of primers that do exactly this. The resulting product is run through Illumina sequencing machines and custom bioinformatics to generate a list of unique receptor sequences in the sample, together with the absolute number of each. This counting process is pretty amazing in and of itself, but not important for this post.
The final output is a snapshot in time — a quantitative representation of the state of the adaptive immune system. When you consider that T-Cell immunity is central to virtually every disease pathway — viruses, infections, autoimmune conditions, allergies, cancer, everything — it’s pretty easy to imagine how transformative this data can be. clonoSEQ uses it as an early warning system for recurrence in many blood cancers. Diversity of the T-Cell population (or lack thereof) can help inform the use of therapies such as PD-1 blockade. The technology underlies more than 650 published papers. Net net, it’s cool.
Layer 2: Individual receptor affinity
And yet, as amazing as this is, until recently there has been a pretty glaring gap in our understanding of immunoSEQ data. We know that each unique receptor is activated by a specific, unique antigen. But understanding which antigen, and what disease is it associated with, turns out to be something of a holy grail, with many folks hitting it from many different angles.
The physics of this “binding affinity” comes down to the magic of protein folding. The DNA sequence identified by immunoSEQ is translated into a chain of amino acids, which in turn self-arranges into a particular physical shape. That shape is what matches up with a target antigen, just like a key in a lock. But predicting how a particular chain will fold is really, really, really (really) hard. One of the best at it is David Baker at UW1 — he’s made some pretty sweet progress in the last year or two and is slowly getting there.
If we knew how each receptor folded AND could algorithmically pair it to the universe of antigens, we’d be set — but that’s a long road. There are other ways to get at the same information, and Adaptive has pioneered two in parallel: machine learning and MIRA.
Layer 2a: Machine learning
Most of our childhood is spent building up internal recognition algorithms — first everything that moves is a choo-choo, then we figure out cars vs. trucks, then we see sports cars vs. sedans, then finally (some of us) distinguish Chargers from Mustangs, and on and on it goes. Pattern recognition is probably the most central feature of our intelligence, and we are shockingly good at it, at least for things where our five senses can pick out the “features” that matter.
It turns out that machines can also learn this way, so long as we identify the features that distinguish whatever we’re trying to classify. And the cool thing is that for computers, the features don’t have to be things we see/hear/smell/taste/feel. And they don’t even have to be that perfect. If there’s a pattern hiding in there somewhere, the Matrix can pick it out.
Back in 2017, Adaptive figured out how to do this for T-Cell repertoires, using cytomegalovirus (CMV) diagnosis as a proof of concept. The process was basically this:
- Collect a bunch of samples that are already categorized as having CMV or not.
- Use immunoSEQ to generate the list of T-Cell receptors in each sample.
- Apply an algorithm called “Fisher’s exact test” on some of the samples to determine which receptors are more common (“enhanced”) in the CMV+ samples than the CMV- ones.
- Use the presence of these “enhanced” receptors as input features to train a model using another subset of the samples.
- Test the resulting model on the rest of the samples.
- Woot!
The hard parts of this (and this is always the case) are #1 (acquiring training data) and #3 (figuring out the features). I’ve purposely downplayed #4 (training the model) because although there is some insane math hiding in there, we’ve gotten really good at applying it over the last few years — it’s just not a big deal anymore.
Since the model works, we can be quite confident that we picked meaningful T-Cell receptors to serve as features. That’s cool, because it means they almost certainly bind to antigens that are part of the disease we’re interested in. And we can repeat this process for as many diseases as we want to — Adaptive has received emergency use authorization from the FDA for “T-Detect”, a diagnostic that uses a trained model to identify past COVID-19 infections. They’ve also started a trial to diagnose Lyme disease. Ultimately, the goal is to “map” the entire universe of T-Cell receptors and create a “Universal Diagnostic” that really would be a game-changer.
Layer 2b: MIRA

Adaptive has also figured out how to directly observe binding affinity in the lab. MIRA (Multiplexed Identification of T cell Receptor Antigen specificity) was actually first published in 2015, but has been refined year over year by Mark Klinger and his team. This approach uses creative bioinformatics to “multiplex” many antigens against a population of T-Cells in parallel:
- Split a sample containing T-Cells into “N” aliquots (“N” may be small or large based on the number of antigens to be tested).
- Prepare “N” pools containing the antigens to test. Each antigen is included in a unique subset of the pools (the image makes this much more clear, click to make it bigger).
- Challenge each pool with one of the aliquots from step #1.
- Sort the resulting T-Cells into positive (bound to one of the antigens in the pool) and negative (did not bind) subsets. This is done using cell sorting technology from folks like Bio-Rad; honestly I don’t know much about the details of how this works — I’m just glad it does.
- Use immunoSEQ to identify the T-Cell receptor sequences in each positive subset.
- A T-Cell that binds to antigen “X” will show up only in the positive subset for the pools that “X” was added to, enabling us to untangle which T-Cells responded to which antigen.
- Bam!
Of course there’s always more to the story. The definition of an “antigen” with respect to MIRA is really quite liberal — any peptide sequence will do. This is super-powerful, but it also glosses over an important challenge. The antigens that T-Cells bind to in real life are short little fragments of foreign DNA, each about 9-15 amino acids long. There are rules about how DNA is cut into these short sequences, but we don’t understand them very well yet (there are models, but their success varies widely). So given a complete genome, say for the SARS-CoV-2 virus that causes COVID-19, it’s not obvious which bits of that (very long) DNA sequence will actually be presented.
If we choose the wrong ones, MIRA might find (real) T-Cell “hits” for antigens that never actually occur in nature. That’s why having multiple ways to get at binding behavior is essential — they reinforce each other. If a T-Cell “lights up” both in MIRA and machine learning models, we can be confident it’s the real deal.
Layer 3: Applying the stack to COVID
Very soon after it became clear that the SARS-CoV-2 was going to f*ck things up for everyone, Adaptive pivoted a ton of work towards trying to figure it out. One thing that came out of this was immuneCODE, an enormous publicly-available repository of immunoSEQ and MIRA data — over 1,400 subjects from all over the world that led to 135,000 high-confidence T-Cell receptors specific to the virus. (Full disclosure: this is one of the last projects I worked on at Adaptive and I’m super-proud of it.)
There’s just a ton of good stuff in there, but this chart really stands out (the version below is from our initial data release; there is more data available in the current drop):
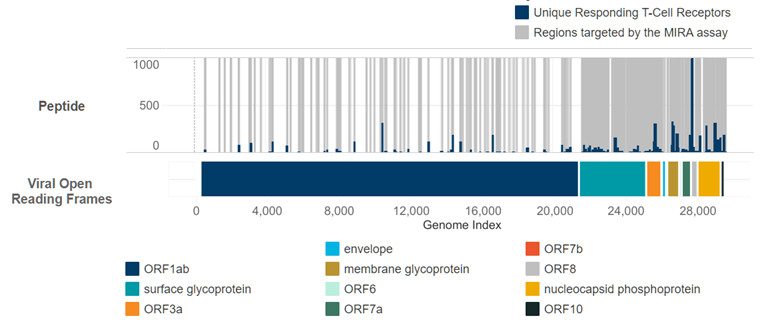
Here’s what you’re looking at. The entire genome of the SAR-CoV-2 virus is stretched out along the X axis. The colored bars denote the different “open reading frames”, most infamously the “surface glycoprotein” in teal starting at index 21,563. This is the section of the genome that codes for the “spike protein” you have surely read about, which makes the virus really good at breaking into healthy cells.
Above the ORF bars is the actual data. The grey areas represent parts of the genome that were “covered” by peptides tested with the MIRA assay. Covering the genome 100% would be cost-prohibitive, so Adaptive used every resource they could find to generate a list of peptides that were likely to occur in nature and probe the most important parts of the virus. In particular you can see the near total coverage at the spike protein. The blue bars in this same area represent unique T-Cells that responded to each part of the virus.
The resulting picture is absolutely magic. It’s a roadmap of the virus that shows us exactly which T-Cells are good at recognizing it, and exactly where on the virus they bind to. Mix in additional assays downstream from MIRA and you can see just how strong the reaction is from each T-Cell. The resolution is mind-blowing.
Remember, this data is 100% public and can be used by anyone. Start with the manuscript and then download/explore it yourself.
Layer 4: Omicron
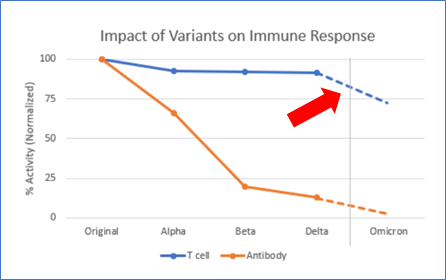
Now we can finally come back to the paper that started us off — Adaptive’s assessment of the potential impact of Omicron on natural and vaccine-mediated T-Cell immunity.
Omicron has a bunch of mutations that make it much more transmissible (f*ck that) and, it appears at least, somewhat less virulent (thankful for small blessings). These mutations also have the potential to help the virus “escape” the protection we’ve received from vaccines and infections over the last year. Tests that measure antibody response to the virus (antibodies are made by B-Cells, which respond more quickly and visibly than T-Cells) show that some of this escape is indeed happening.
But what about the T-Cells? Again the data isn’t super-definitive yet, but it does appear that fewer people with Omicron end up in the hospital vs. previous variants. One reason for that could be the T-Cell response. T-Cells take a bit of time to rev up, so they aren’t that great at stopping initial infection — but they are aces at shutting it down.
It turns out that the immuneCODE data is perfectly suited to look at this in a quantitative way. This graph snipped from the Omicron paper should look somewhat familiar:

The X axis here is still position on the genome, but it’s been zoomed in to only show the “surface glycoprotein” section that codes for the spike. Because the spike is so unique to the virus, COVID vaccines are mostly composed of fragments from this ORF. The black lines represent the parts of the spike with a strong T-Cell response, just as we saw before (the data is newer so the shape is a little different).
The red lines here mark where mutations have occurred in the Omicron variant. And here’s the payoff pitch: by observing where the T-Cell responses and mutations overlap, we can see where the response may be negatively impacted. Once you have the map, it’s really quite a simple thing to do. Standing on the shoulders of giants indeed.
The blue line in the chart shows Adaptive’s best guess at what this impact will be — it’s a little more complicated that I imply above, but not much. It depends on the strength of each T-Cell response, and in some cases the overlap isn’t perfect and so some assumptions are required. At the end of the day, Adaptive calculates that we probably lose about 30% of the T-Cell response to Omicron vs. previous variants. Notably, they did this same analysis against the older variants, and the impact is far less.
70% as good as before isn’t great. But all things considered, I’ll take it. Science and industry’s progress against COVID is a modern miracle. It hurts my heart that the public health side is such an utter failure by comparison. But at least for this article, I’m determined to not let that overshadow the awesome.
Math works, and it will carry the day.
1 Folks who know protein folding far better than I do corrected me here — the AlphaFold team at DeepMind (Google) won the biannual CASP protein structure prediction contest in 2018 and again in a dominating fashion in 2020. Protein folding is not yet completely solved but clearly it’s moving fast — super-encouraging!